
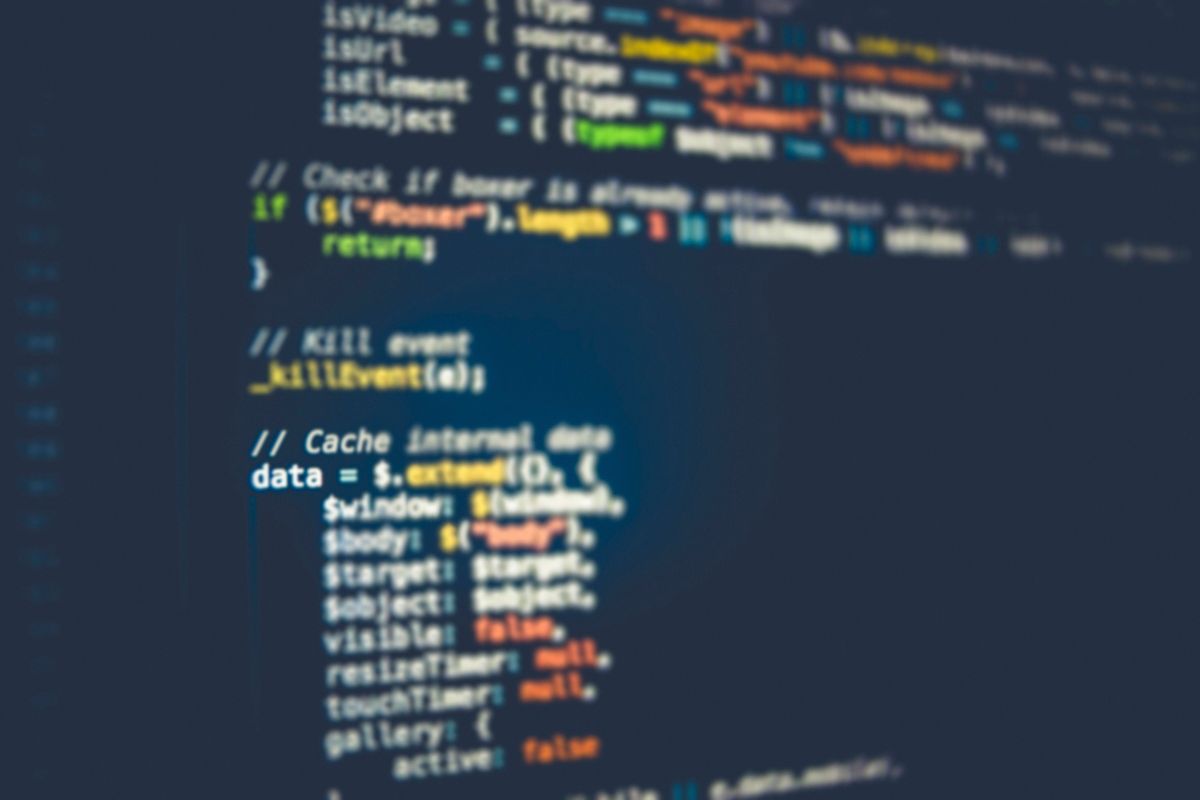
Debugging is an essential skill for any developer, and mastering it can greatly enhance your efficiency and productivity. In JavaScript, where even small errors can have significant consequences, knowing how to effectively troubleshoot your code is crucial.
Let's create a table to explain a few points from the blog in a structured format. We'll use columns to represent different aspects of each point.
| Point | Description | Example |
|---|---|---|
| Using Console.log for Basic Debugging | Console.log is a simple yet effective debugging technique in JavaScript. It allows developers to output variable values, object properties, or messages to the browser console for tracking the flow of execution and identifying potential issues. | javascript let x = 10; console.log("The value of x is:", x); |
| Leveraging Browser Developer Tools | Modern web browsers come equipped with developer tools such as Google Chrome's DevTools or Mozilla Firefox's Developer Edition. These tools offer a comprehensive set of features for debugging JavaScript code, including inspecting elements and analyzing network requests. | Browser developer tools provide a comprehensive set of features for debugging JavaScript. |
| Utilizing Breakpoints | Breakpoints are markers placed within the code that pause execution when reached. They allow developers to inspect the program state at that particular moment, step through the code line by line, and identify errors. | Setting breakpoints in the code enables developers to analyze the program's execution flow. |
| Employing Watch Expressions | Watch expressions are variables or expressions monitored during debugging. Developers can keep track of specific variables or expressions and quickly identify changes or anomalies in the program state. | Watching variables can provide insights into their values and help diagnose issues. |
This table provides a structured overview of each debugging technique, its description, and an example demonstrating its usage. Using tables in this manner can help readers quickly grasp key concepts and compare different techniques.
Mastering Debugging Techniques in JavaScript
In this blog, we will explore various debugging techniques in JavaScript to help you identify and fix common coding errors.
1. Introduction to Debugging in JavaScript
This is the process of identifying and resolving errors or bugs within a program. In JavaScript, errors can occur due to syntax issues, logic errors, or unexpected behaviour. Effective debugging involves using various tools and techniques to pinpoint the root cause of these errors and implement appropriate fixes.
2. Setting Up Your Debugging Environment
Before diving into debugging techniques, it's important to set up a conducive debugging environment. Ensure you are working with a modern web browser equipped with robust developer tools such as Google Chrome's DevTools or Mozilla Firefox's Developer Edition. These tools provide a comprehensive set of features for debugging JavaScript code.
3. Using Console.log for Basic Debugging
Console.log is perhaps the simplest yet most commonly used debugging technique in JavaScript. By strategically placing console.log statements in your code, you can output variable values, object properties, or messages to the browser console. It allows you to track the flow of execution and identify potential issues.
// Example of using console.log for debugging
let x = 10;
console.log("The value of x is:", x);
4. Leveraging Browser Developer Tools
Modern web browsers come with built-in developer tools that offer powerful debugging capabilities. These tools allow you to inspect HTML elements, modify CSS styles, and debug JavaScript code in real-time. By opening the developer console, you can view console.log outputs, inspect variables, and analyze network requests.
5. Utilizing Breakpoints
Breakpoints are markers placed within your code that pause execution when reached, allowing you to inspect the program state at that particular moment. You can set breakpoints directly within your browser's developer tools or through your code editor. Once a breakpoint is hit, you can step through the code line by line, examine variable values, and identify errors.
6. Employing Watch Expressions
Watch expressions are expressions or variables that you monitor while debugging. By adding watch expressions to your debugging session, you can keep track of specific variables or expressions and quickly identify changes or anomalies. This can be particularly useful when dealing with complex data structures or conditional logic.
7. Using the JavaScript Debugger Statement
The debugger statement is a powerful tool for debugging JavaScript code. When encountered, it triggers a breakpoint in the code, allowing you to inspect the program state in real-time. You can place the debugger statement strategically within your code to pause execution at critical points and diagnose issues.
// Example of using the debugger statement
function calculateSum(a, b) {
    debugger; // Pause execution here
    return a + b;
}
8. Analyzing Stack Traces
Stack traces provide valuable information about the sequence of function calls leading up to an error. When an error occurs, JavaScript generates a stack trace that lists the function calls along with their respective line numbers. Analyzing stack traces can help you trace the origin of an error and understand the execution flow of your code.
9. Testing and Debugging Asynchronous Code
Asynchronous code presents unique challenges for debugging due to its non-linear execution flow. Promises, async/await, and callback functions can complicate the debugging process. To effectively debug asynchronous code, utilize tools like async/await breakpoints, Promise.catch(), and async function logging.
Most common issues
Here's a list of some of the most common issues programmers face when debugging JavaScript code:
- Syntax Errors: Incorrect syntax such as missing parentheses, semicolons, or curly braces can lead to syntax errors, causing the code to break.
- Undefined Variables: Referencing variables that have not been declared or initialized can result in undefined variable errors.
- Type Errors: Attempting to perform operations on incompatible data types can lead to type errors, disrupting the program's execution.
- Logic Errors: Flaws in the program's logic can cause unexpected behaviour or incorrect output, making it challenging to identify the root cause of the issue.
- Asynchronous Code Bugs: Dealing with asynchronous code using Promises, async/await, or call-backs can introduce complexities and bugs related to timing and order of execution.
- DOM Manipulation Errors: Manipulating the Document Object Model (DOM) incorrectly can result in rendering issues, event handling problems, or unexpected behaviour in web applications.
- Cross-Browser Compatibility: Differences in browser implementations and support for JavaScript features can lead to compatibility issues, requiring developers to debug and adjust their code accordingly.
- Memory Leaks: Improper memory management, such as creating circular references or holding onto unused objects, can result in memory leaks that degrade performance and stability over time.
- Network Errors: Errors related to network requests, such as incorrect URLs, CORS (Cross-Origin Resource Sharing) issues, or server-side errors, can disrupt the functionality of web applications.
- External Library Integration: Integrating third-party libraries or APIs can introduce compatibility issues, version conflicts, or unexpected behaviour that requires debugging and troubleshooting.
By being aware of these common issues, developers can adopt proactive debugging practices and utilize appropriate techniques to address them effectively.
Conclusion
Mastering debugging techniques in JavaScript is essential for every developer striving to write clean, robust code. By familiarizing yourself with the various tools and techniques discussed in this blog, you can streamline the debugging process and tackle coding errors with confidence. Remember to approach debugging systematically, leveraging the full spectrum of available tools and resources.
Debugging is not just about fixing errors; it's about understanding your code deeply and continuously improving your skills as a developer. Embrace the debugging process as an opportunity for growth, and you'll emerge as a more proficient and efficient JavaScript developer.


Write a comment